
Discover how data analytics work in the SAP Business One Web Client.
Some of SAP’s most valuable features rely on the ability to analyse data and create comprehensive charts, graphs, and cards. These functionalities are integral to the SAP experience, and the SAP Business One Web Client introduces an important new concept for users who depend on them.
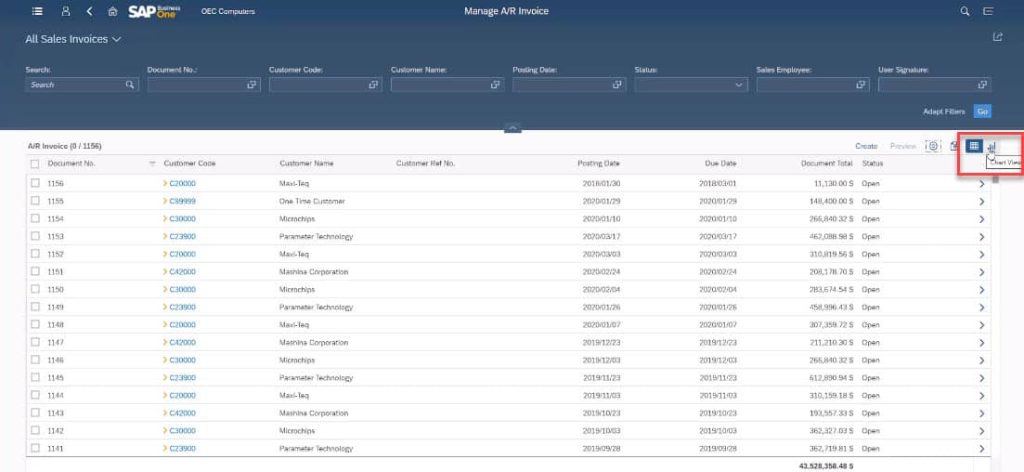
The Web Client features a new navigation tool that encapsulates all documents and all master data. The List View gives users unprecedented flexibility and power when managing enterprise data. Combined with Chart View, SAP empowers executives to make informed decisions quickly.
SAP Business One Web Client List View and Chart View Analytics
Any search query can be expressed in list view. The system will show documents, customer codes, and master data records that correspond with the term being searched for. Users can change and reorder columns according to their query needs.
List view accommodates numeric and non-numeric fields. Users can choose between these fields and any other field shared between the records shown. Changing those fields allows users to quickly create comprehensive analytics graphics representing the most important data.
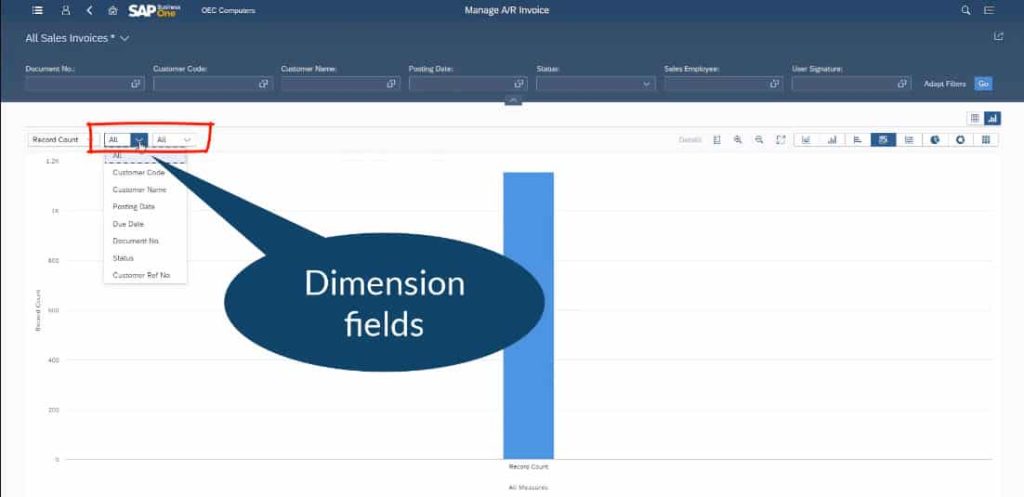
Upon switching to chart view, the Web Client will transform all visible records into a series of intuitive charts. This makes it easy for users to search for data, correlate the data, and generate presentation materials on-the-fly.
The SAP Business One Web Client allows users to specify the dimension fields of chart data. Any data point visible in the list view can be used as a chart axis in chart view. Users can select between Record Count and Document Total to determine the range of visibility against which the auto-generated charts compare their datasets.

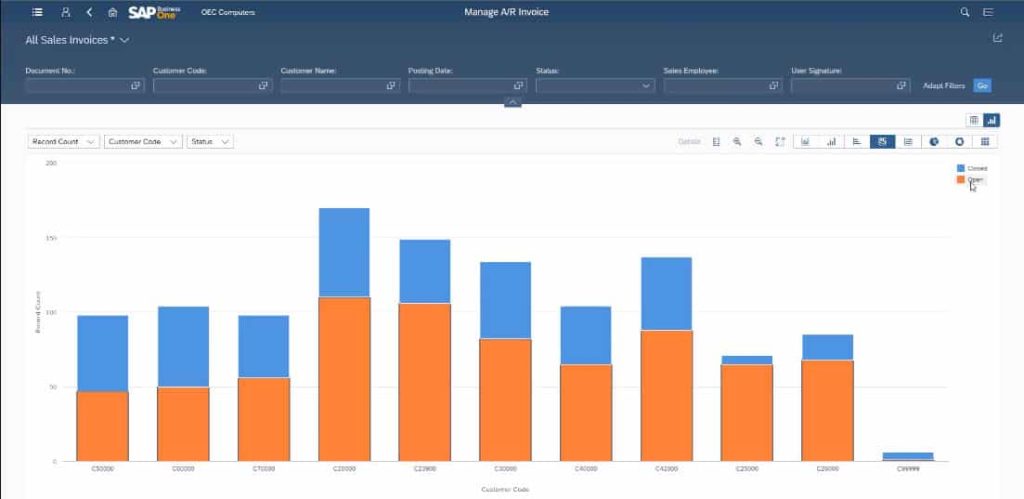
From there, users select individual status markers from among the records visible in list view. If Record Count is enabled, users can immediately see the relevant status data expressed per-record, according to the selected dimension field.
For example, you could select Record Count, set Customer Code as your dimension field, and then select Invoice Status as your status marker. This would show the number of open invoices you have per customer, making it immediately clear where the company has to look to reconcile its debts.
These results can then be further manipulated. You can choose new views, add new data points, and change fields. The SAP Business One Web Client will change the corresponding data in real-time.
Click here to watch a detailed step by step video on Analytics.
Introduction to Advanced Views: The Heat Map
SAP Business One Web Client users are not limited to two-dimensional chart views. Users may also select multi-dimensional views that create sophisticated heat map charts. In addition to the traditional two axes of a list chart view, users can add colour-coded data representation for each record captured.
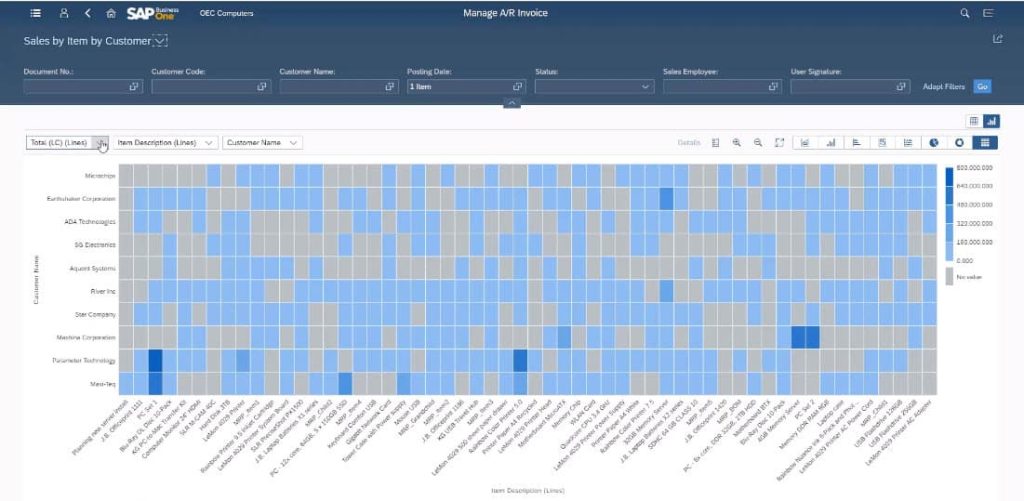
The result is a three-dimensional view that adds depth to the visible data, which could represent any data range expressed as a column in the list view. Users may also incorporate formulas directly into their charts, creating new aggregated data points directly within the search results panel.
For more information on the SAP Business One Web Client, check out our full YouTube playlist here or get in touch with the SMB Solutions team today!