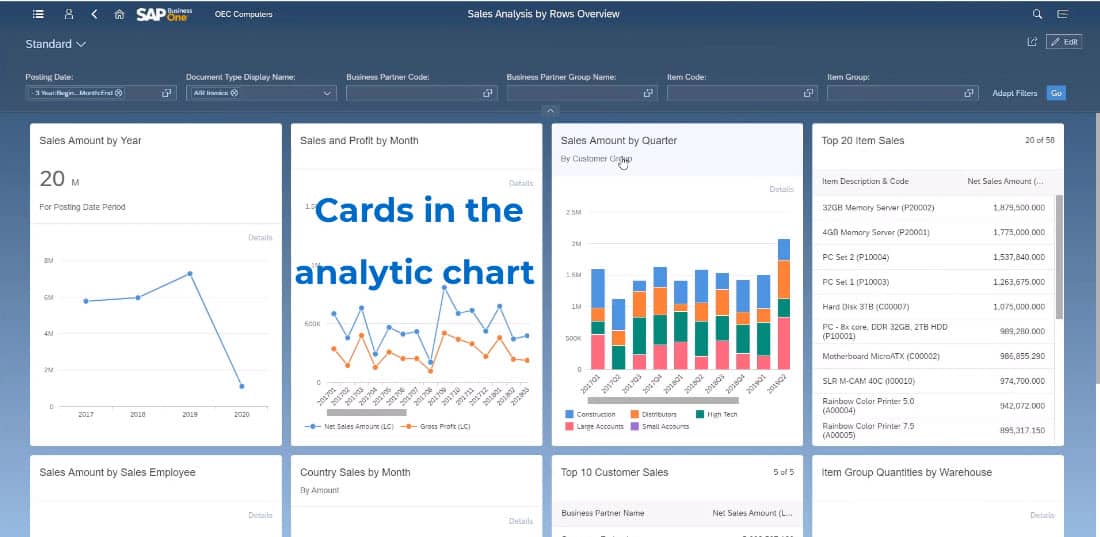
Learn how to use cards in the SAP Business One Web Client.
SAP Business One Web Client users can easily create analytics charts directly through the client’s search and filter functions. Every separate set of analytics can then be saved, shared, or grouped into card format.
Cards allow users to create mini-presentations of in-depth analytics. Users viewing cards can gain granular analysis by diving into the analysis screen from the card menu. With a handful of well-built cards, users can give executives and stakeholders a comprehensive overview of the company’s latest data.
Analytics are Available Directly from the Card Menu
Simply click on any card’s header to open up the analytics view for that card. In the analytics view, users can reorganize data, change filters, and more. Any changes made will reflect on the card. Analysts can also set permissions to lock cards from unauthorized users.
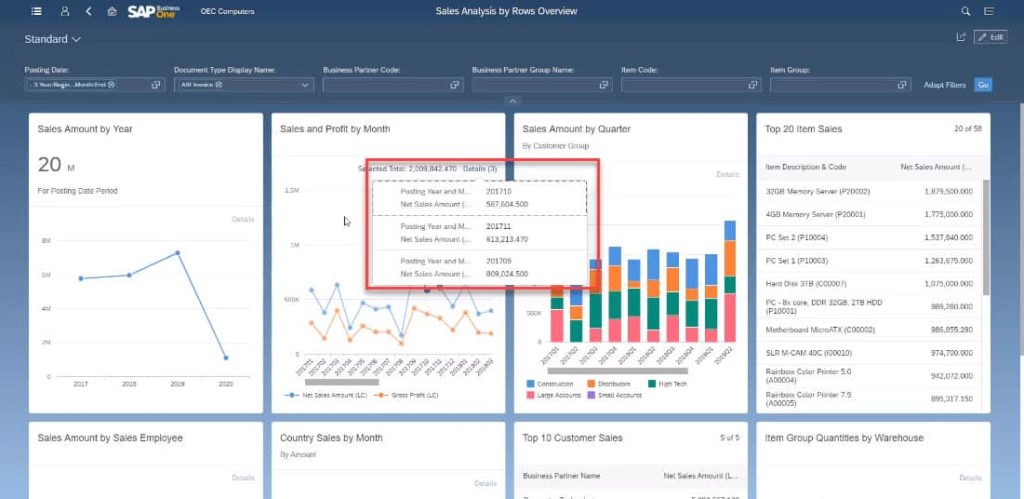
All of the features that users can access from the list view screen and the analytics screen are also available in the card overview screen. Users can select individual data points to view specific numbers directly on the card, without having to exit the overview screen.
Users can zoom in and out of specific charts and graphs by holding CTRL and scrolling the mouse wheel.
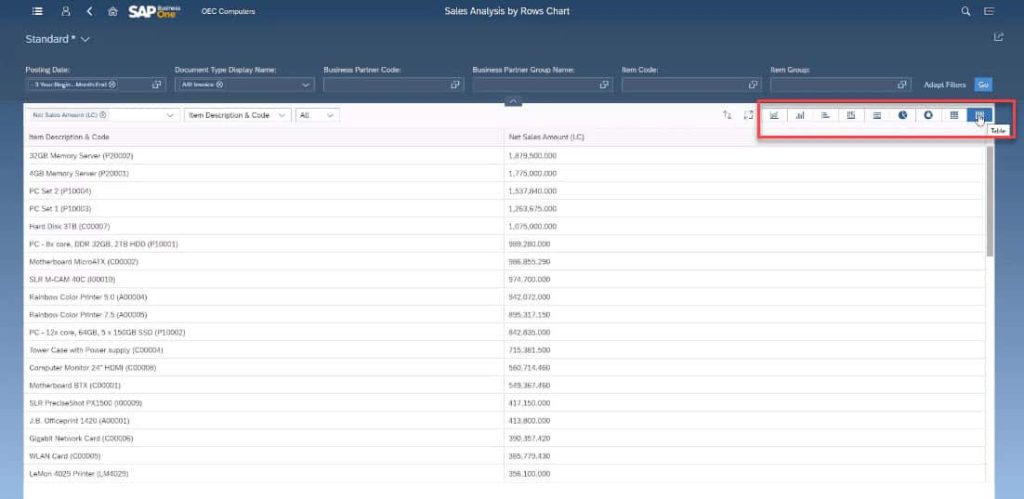
Additionally, cards can show data points in list view, making automatically organized lists easy to create and present. Users can click on list-view cards and change the chart view if they wish, creating visual presentations of list data on the fly.
Cards Offer Comprehensive Analytics At a Glance
One of the most useful filters available in the card overview screen is Posting Date. Users can save a specific timeframe as default when creating analytics cards. Changing this date and pressing on Go simultaneously updates every card on the screen.
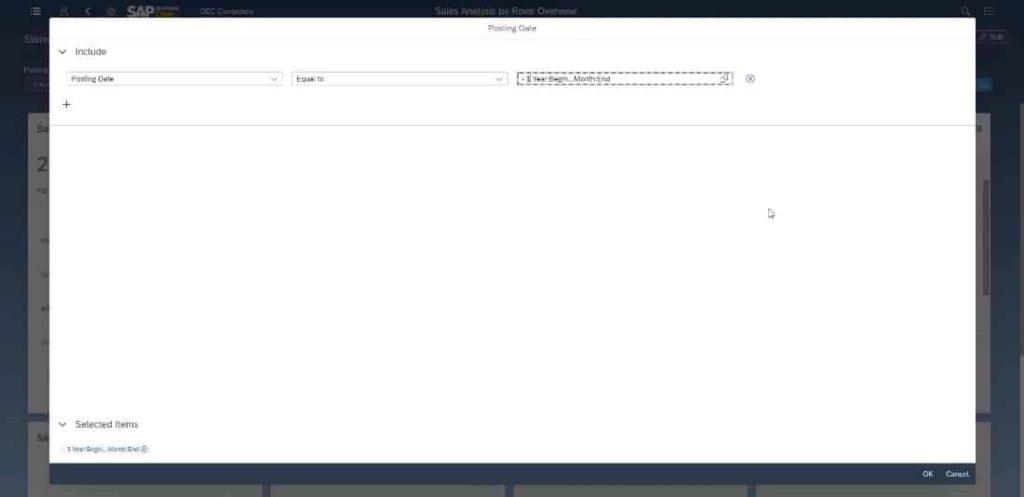
Changing this date and pressing on Go simultaneously updates every card on the screen.
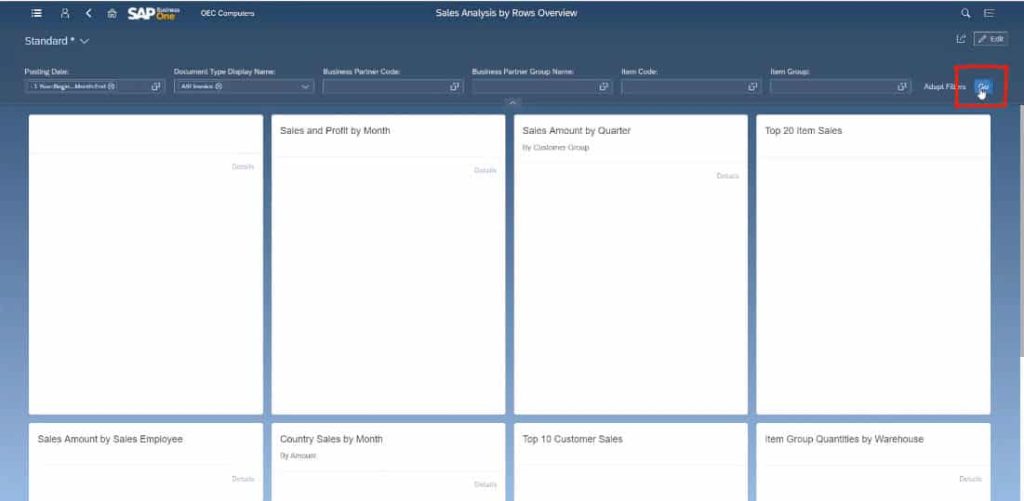
This makes the card overview a powerful presentation tool for data analytics. Executives and stakeholders can immediately obtain comprehensive information about company performance with a few short clicks.
Click here for a detailed step by step video on Cards in the SAP Business One Web Client.
Introducing the Card Designer
SAP Business One Web Client users can access the Card Designer directly from the overview screen. This provides access to card-specific controls. Users can add and delete cards, move cards around, and edit card presentation data.
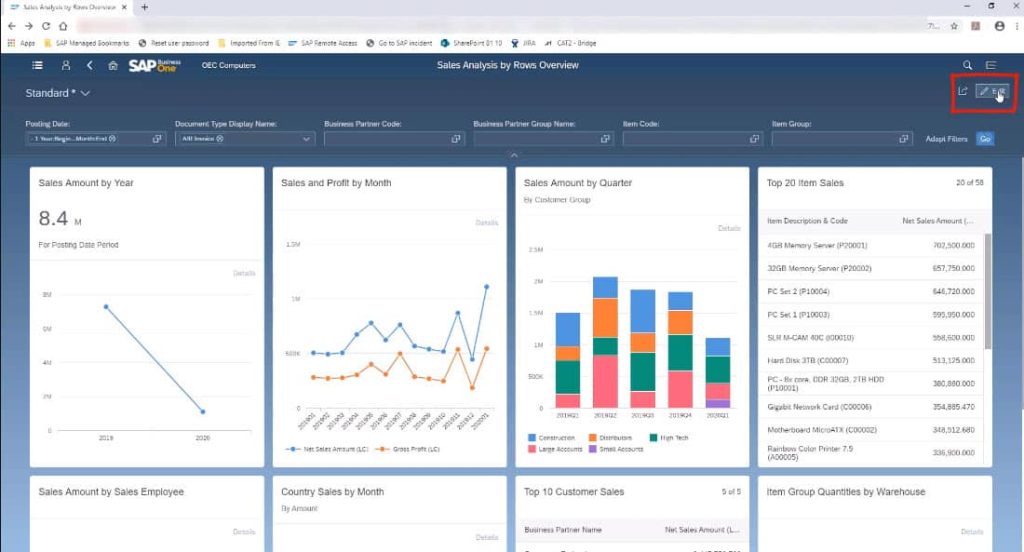
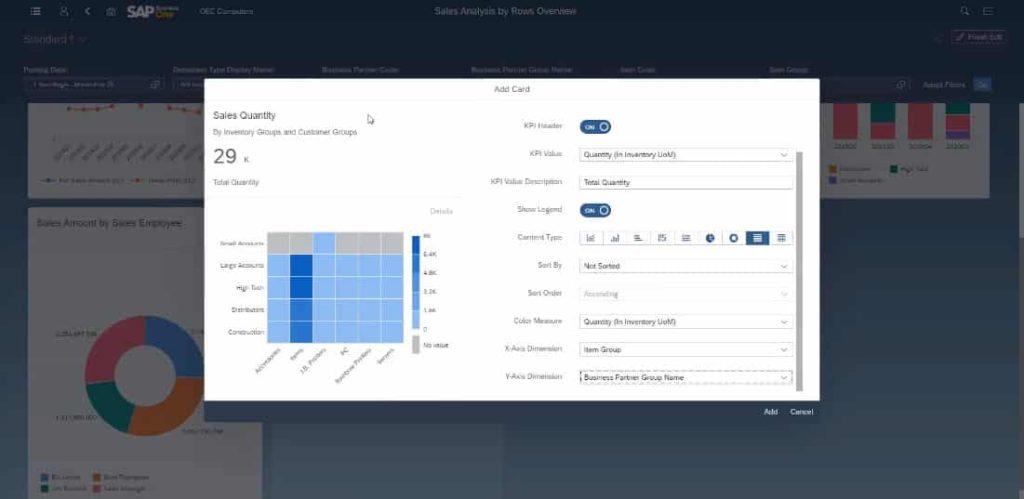
Enter Edit Mode and create a new card or edit an existing one. The card designer will pop up. Here you can change the card title, x-axis and y-axis data sources, and the card’s default chart view. As you manipulate these parameters, the card preview will update in real-time, showing you exactly how the finished card will look.
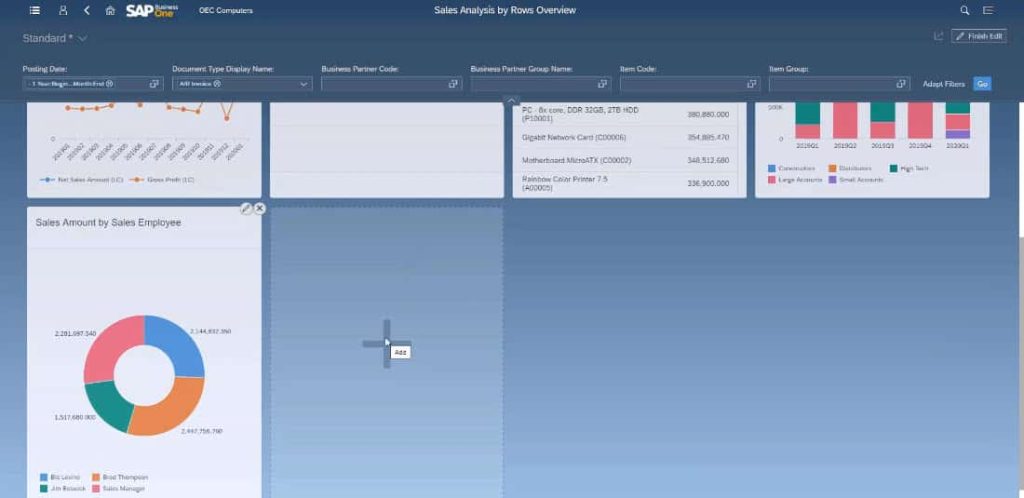
The card designer includes KPI measurement values drawn from the list of measurements globally available. Similarly, the x-axis and y-axis values can be drawn from any compatible data set. The resulting card can also be saved as a tile and presented on the home screen dashboard. The entire card overview screen can also be linked to a tile and made immediately accessible from the dashboard.
For more information on the SAP Business One Web Client, check out our full YouTube playlist here or get in touch with the SMB Solutions team today.

